Ground-Based Measurements
Contents
Ground-Based Measurements
(10 minutes)
Learning Objectives:
Become familiar with which measurements are core validation/calibration data sets
Know the sampling strategy and naming conventions for each campaign
Learn where to find and search for SnowEx data
Data Descriptions
What ground-based data sets are central for all field campaigns?
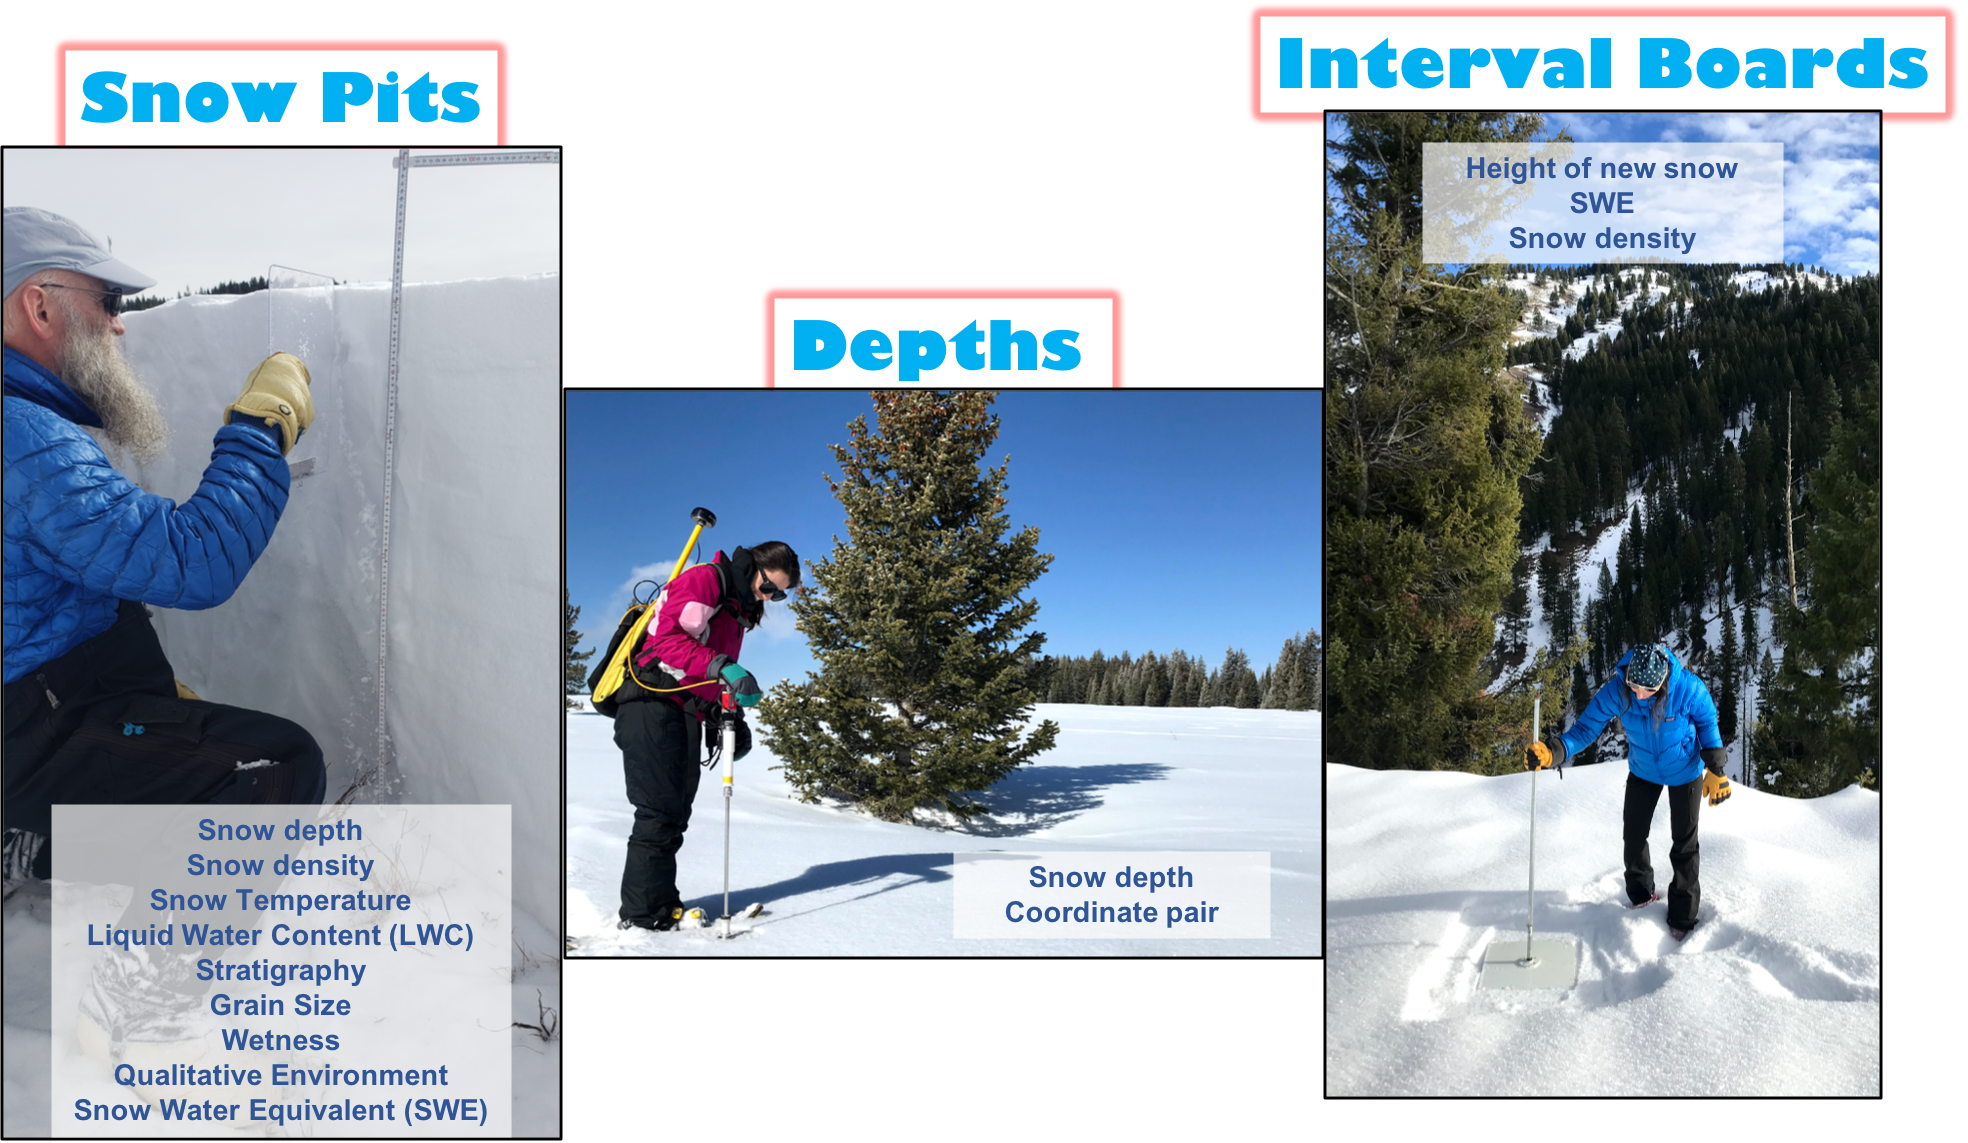
Figure 1. Ground-based measurements central to the SnowEx campaigns. (L) Snow Pit: Observer measures the stratigraphy in the snow pit. (M) Depth Transects: Observer uses the MagnaProbe to measure snow depths. (R). Interval Boards: Observer stomps down the snow to place the interval board for another weekly long measurement cycle.
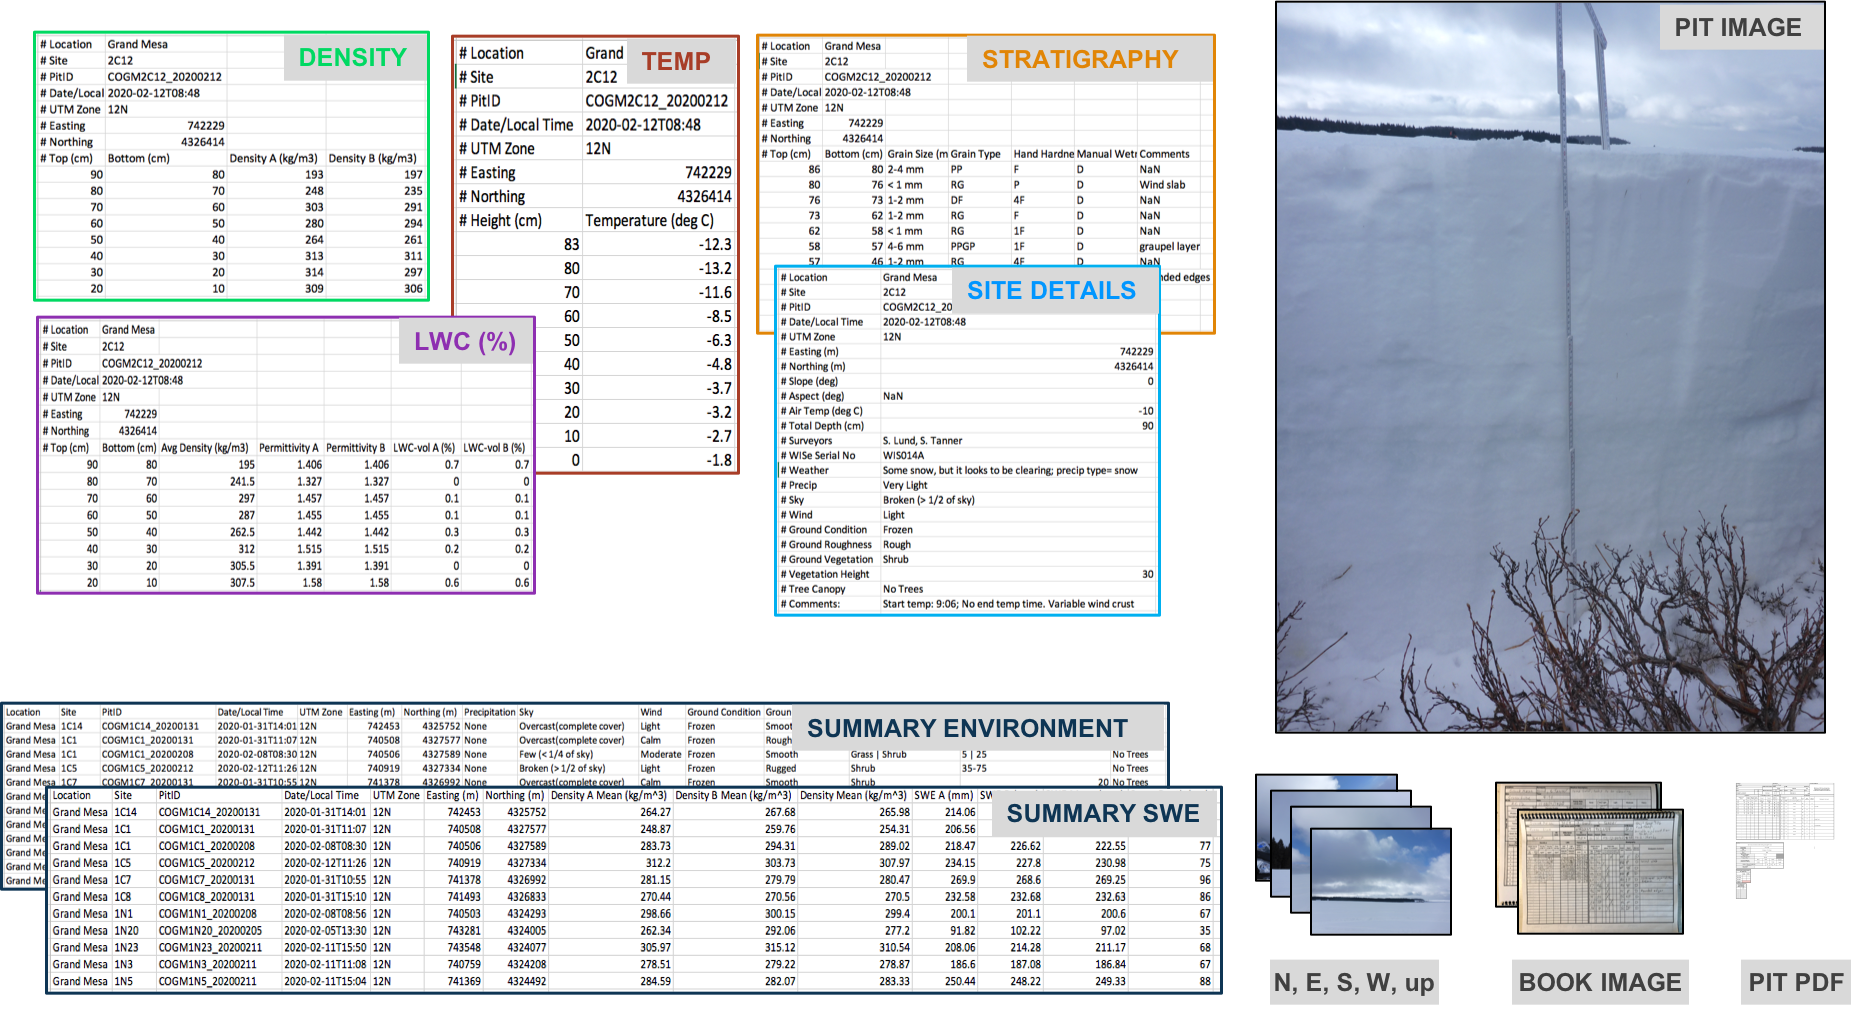
What is a snow pit? ⇨ ‘Layer data’ & ‘Site data’ in the SnowEx database
A snow pit is a vertical profile of snow from the snow surface to the ground. This is where we collect a suite of ground observations that aid instrument and model development.
What are depth transects (spirals)? or simply depths ⇨ ‘Point data’ in the SnowEx database
These are point meausurements that tell you how deep the snow is at georeferenced locations. There are several instruments available to capture snow depth, some of which are an avalanche probe, MagnaProbe, or Mesa2.
What is an interval board? ⇨ soon to be ‘Point data’ in the SnowEx database
An interval board is a 2x2” board with a vertical pole attached at the center. The board surface is our reference to track the amount of new snow that falls between field visits. The board remains fixed for the season, and gets cleared each visit.
Additional detail on what’s in a snow pit
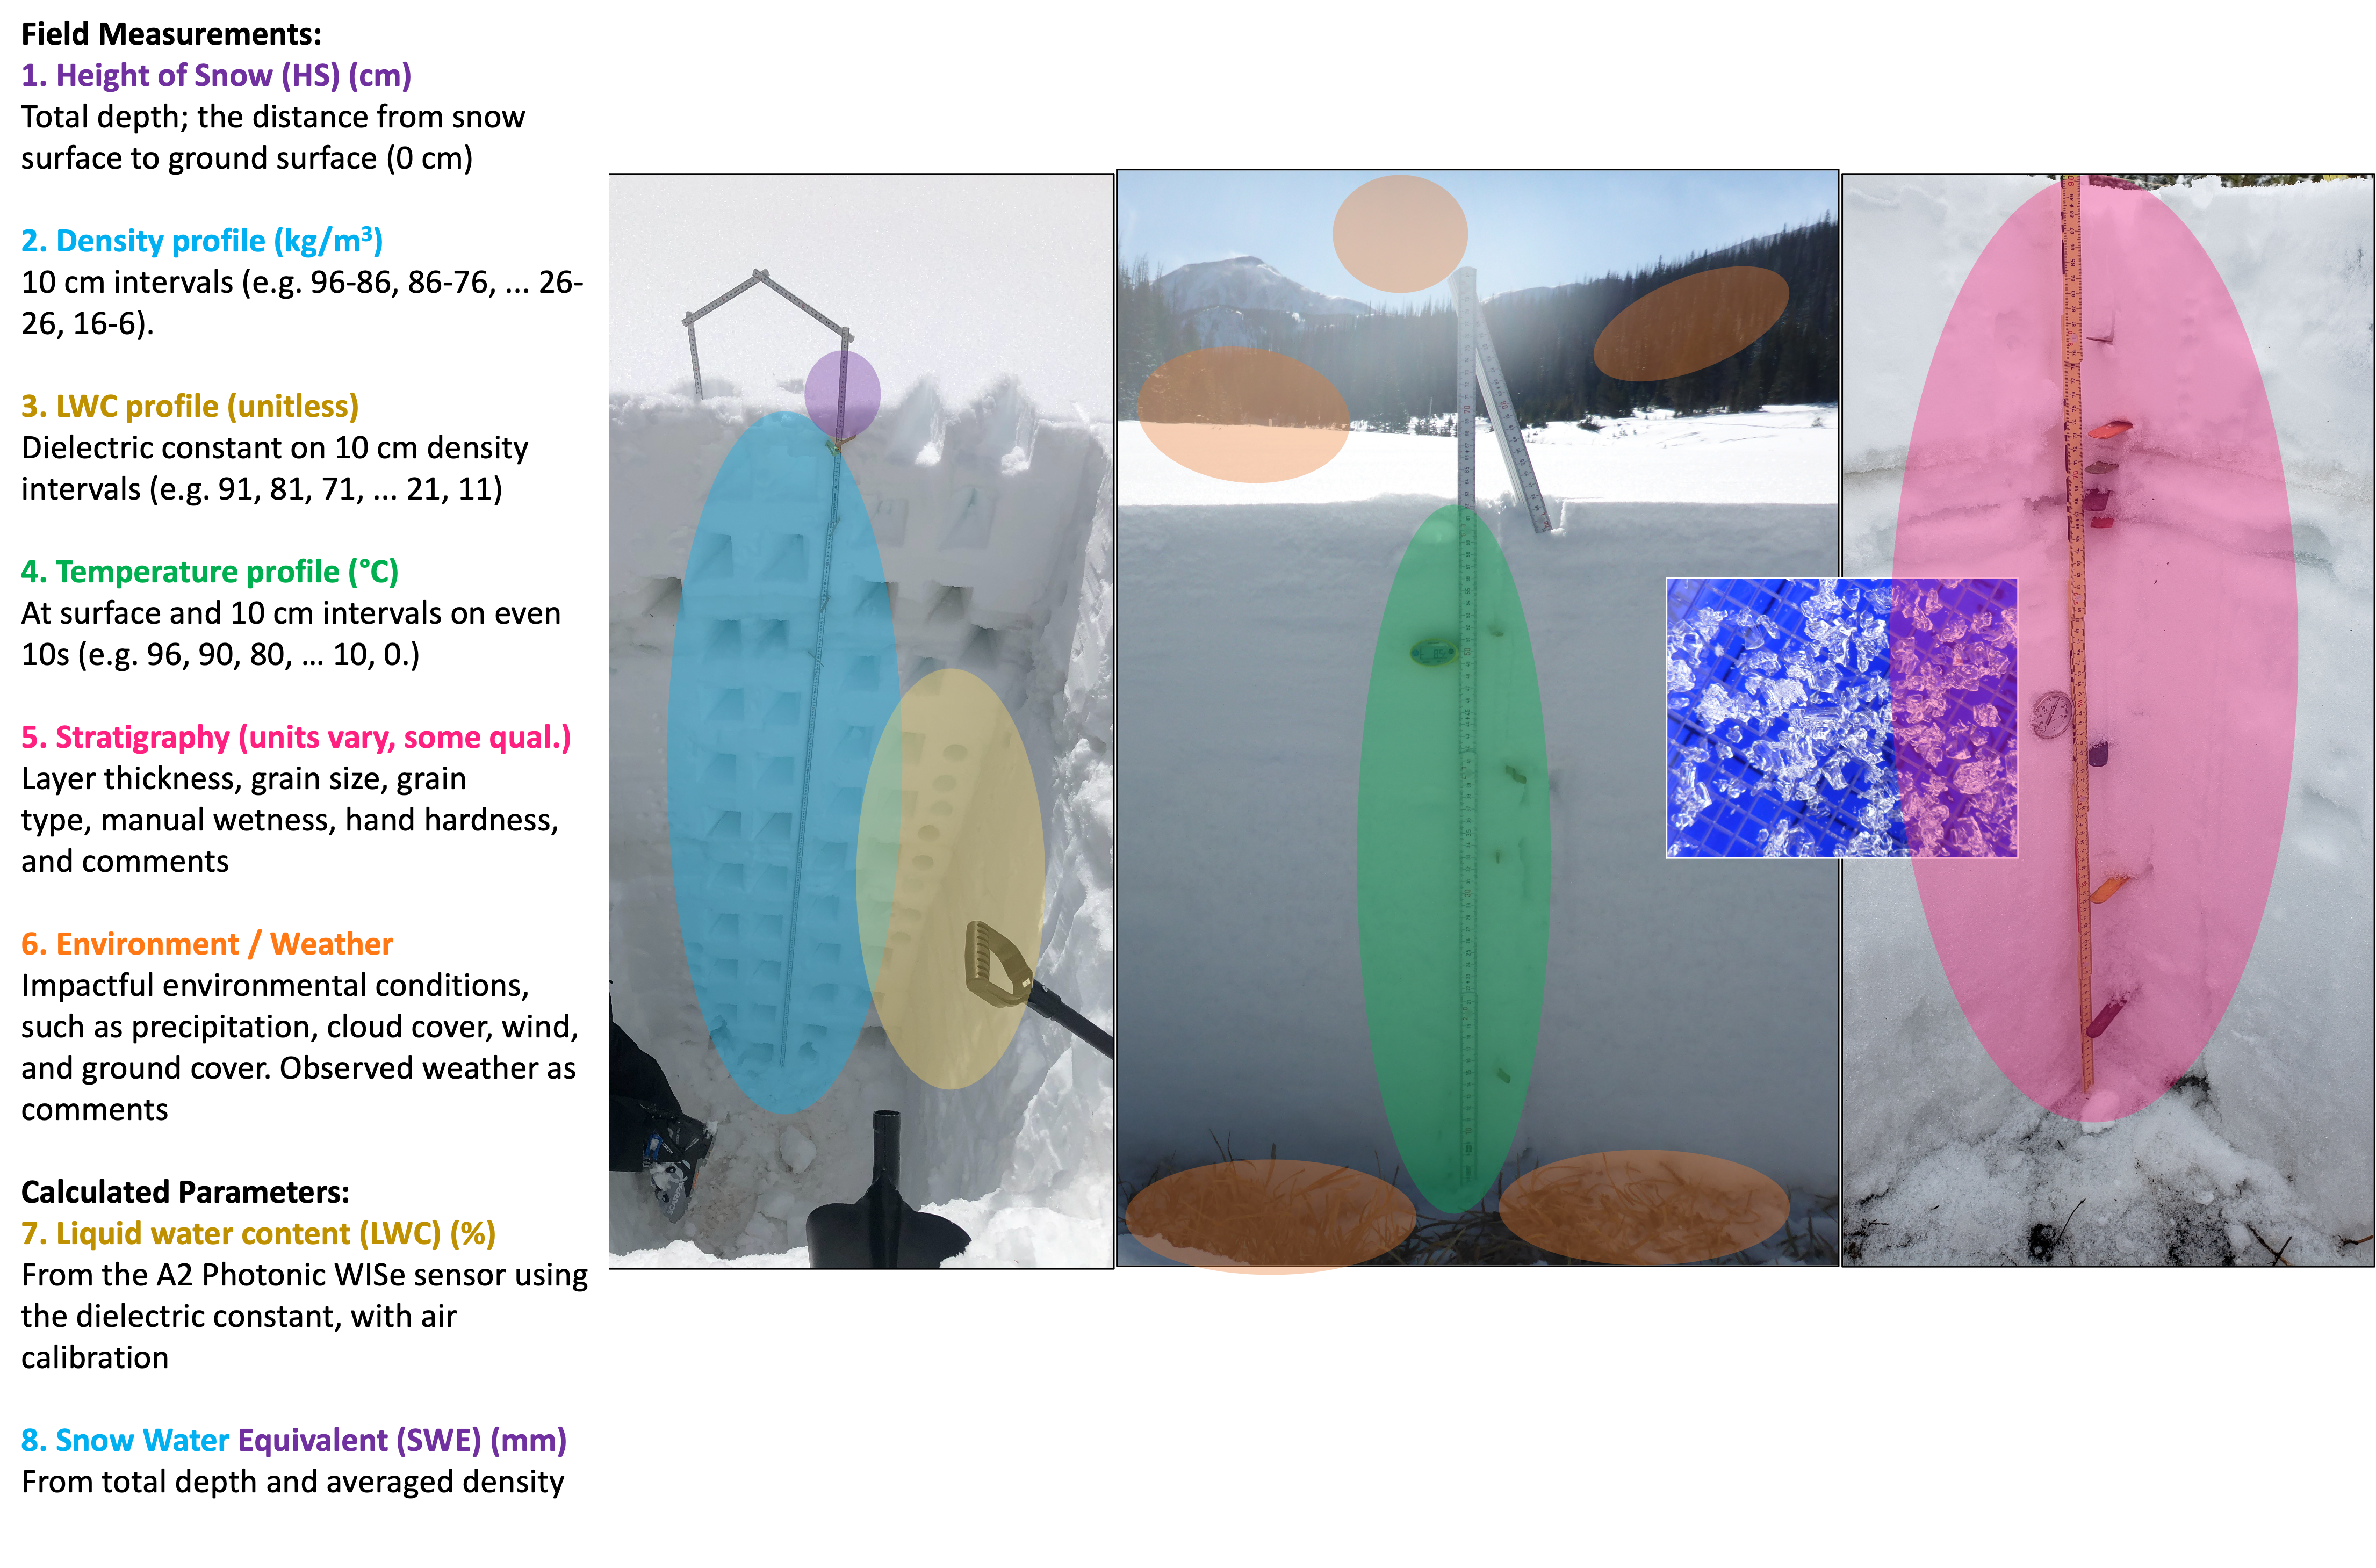
Figure 2. Description of parameters that come from a single snow pit visit. The colored ovals on the images correspond to the colored measurements on the left side.
Explore more detail in the 2020 Experimental Plan
Data Collection
Field note photos from one pit visits. We call these Pit Sheets.
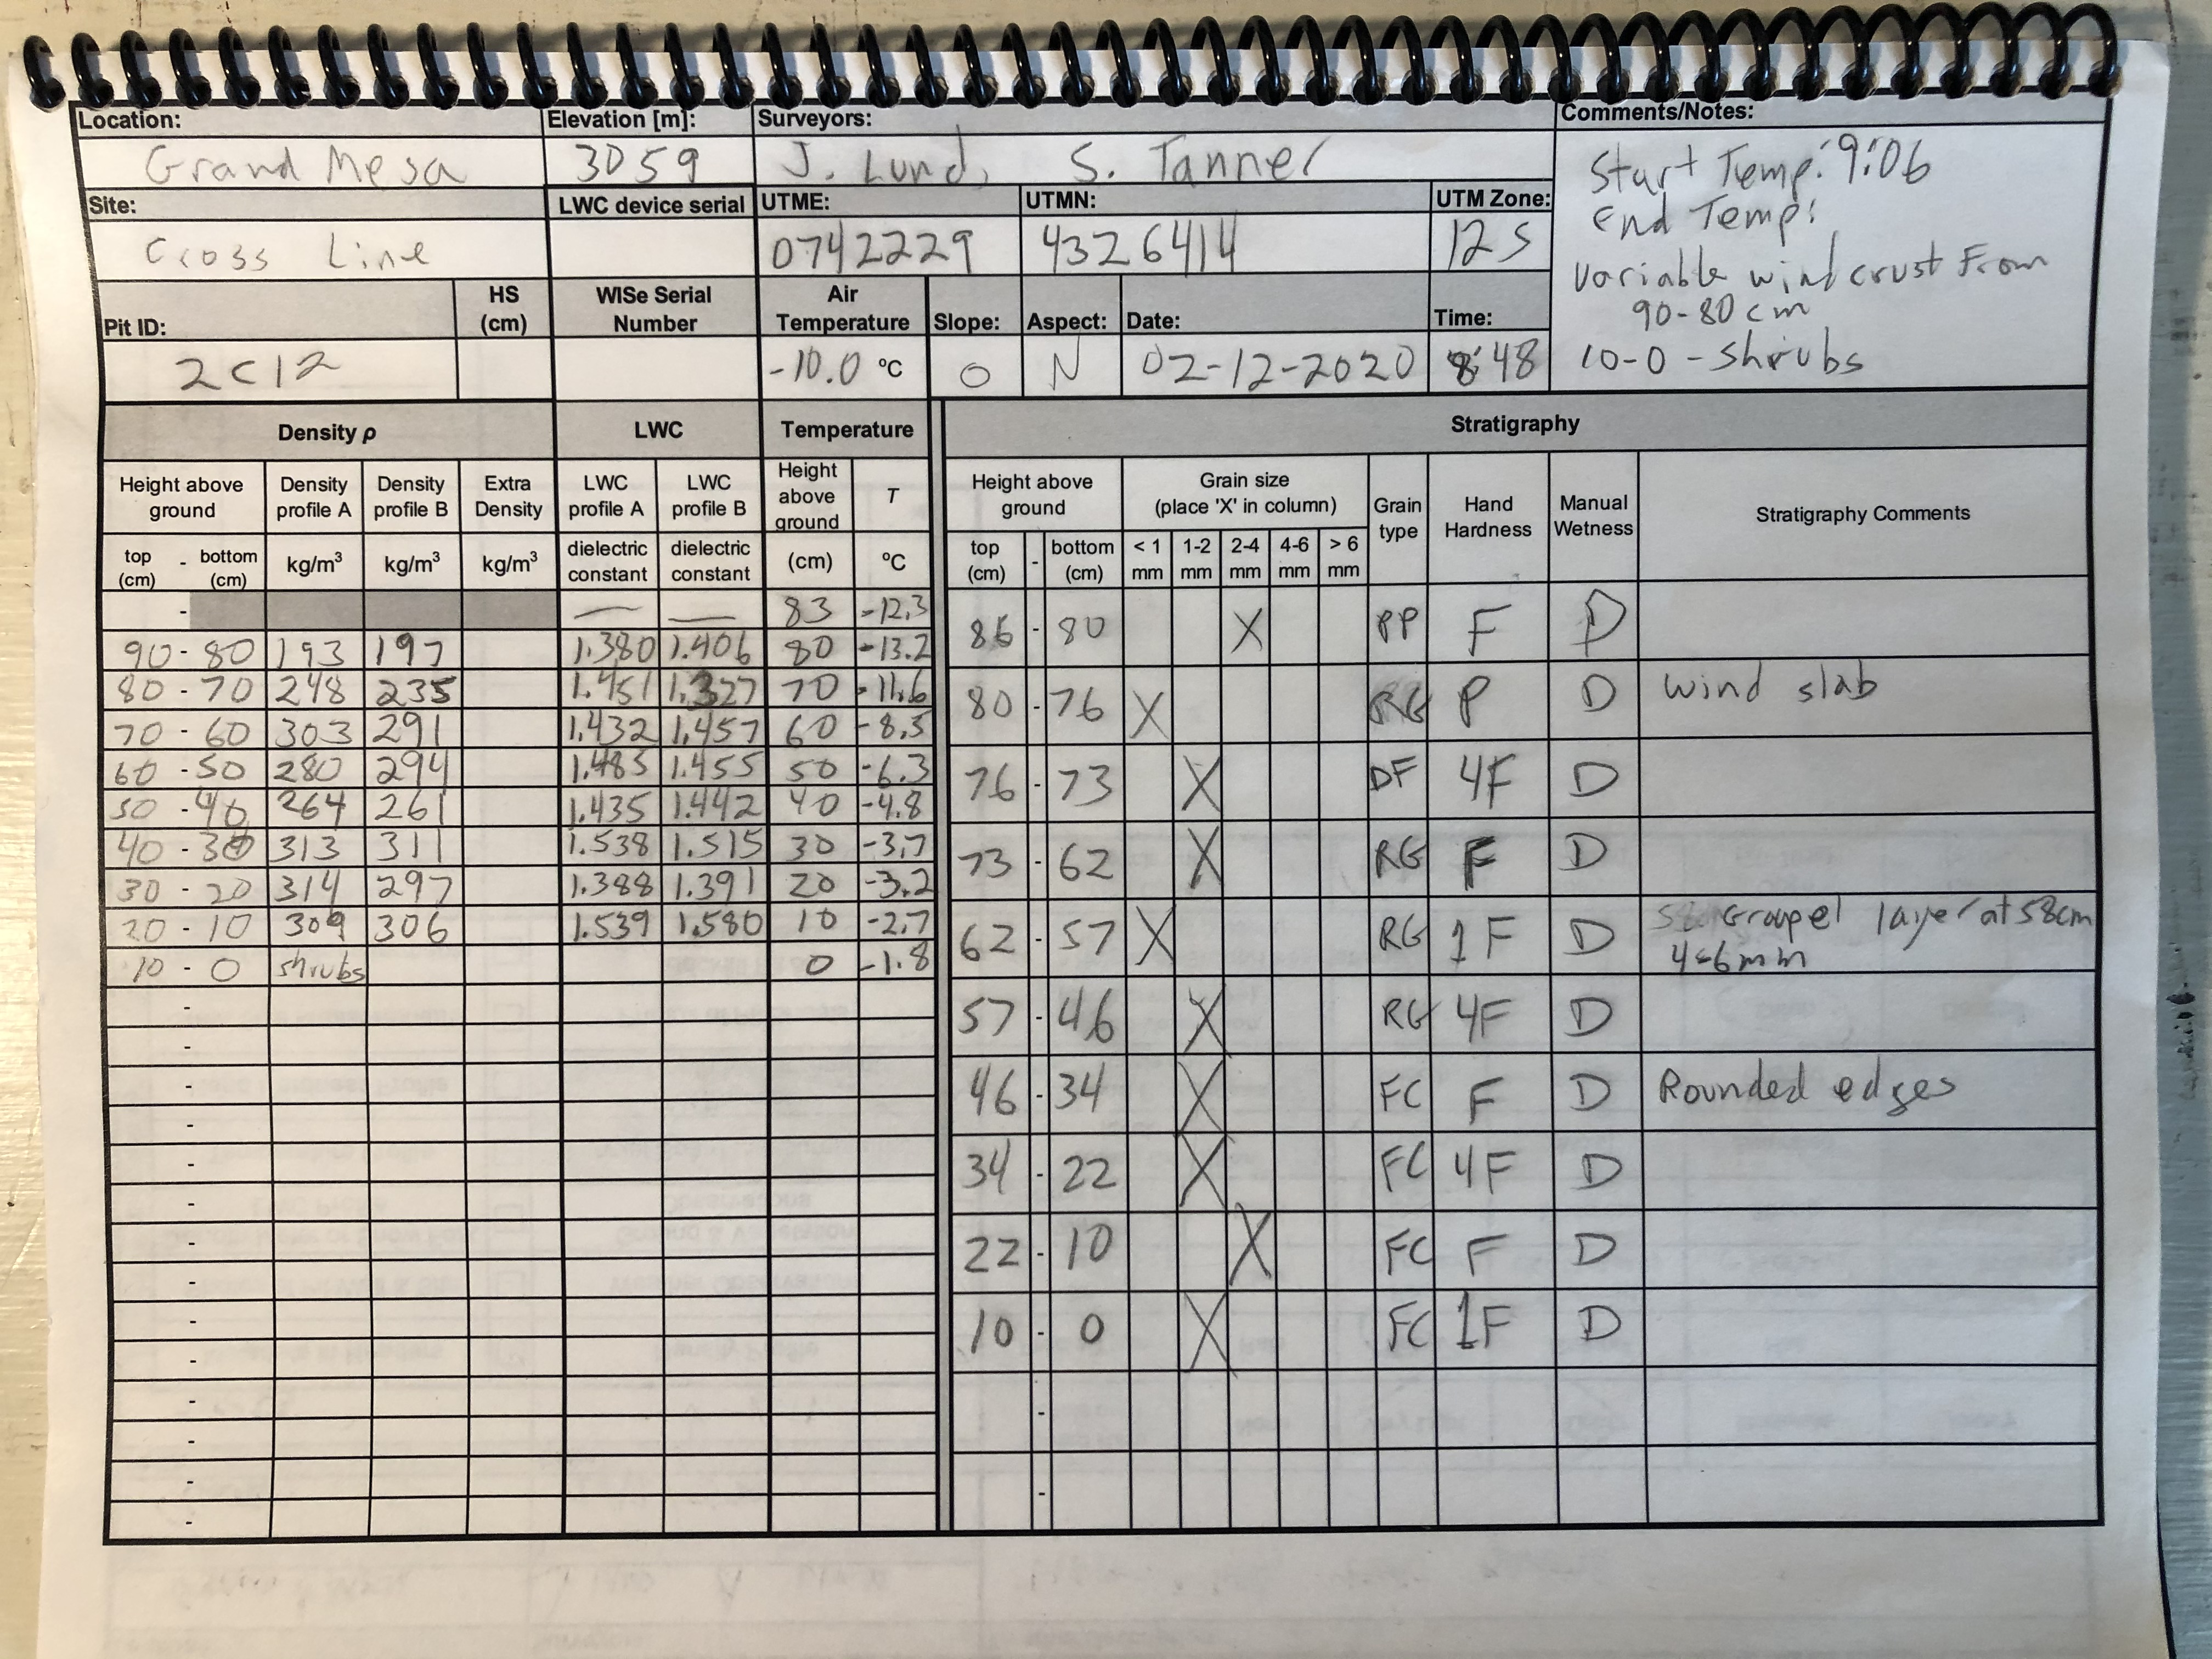
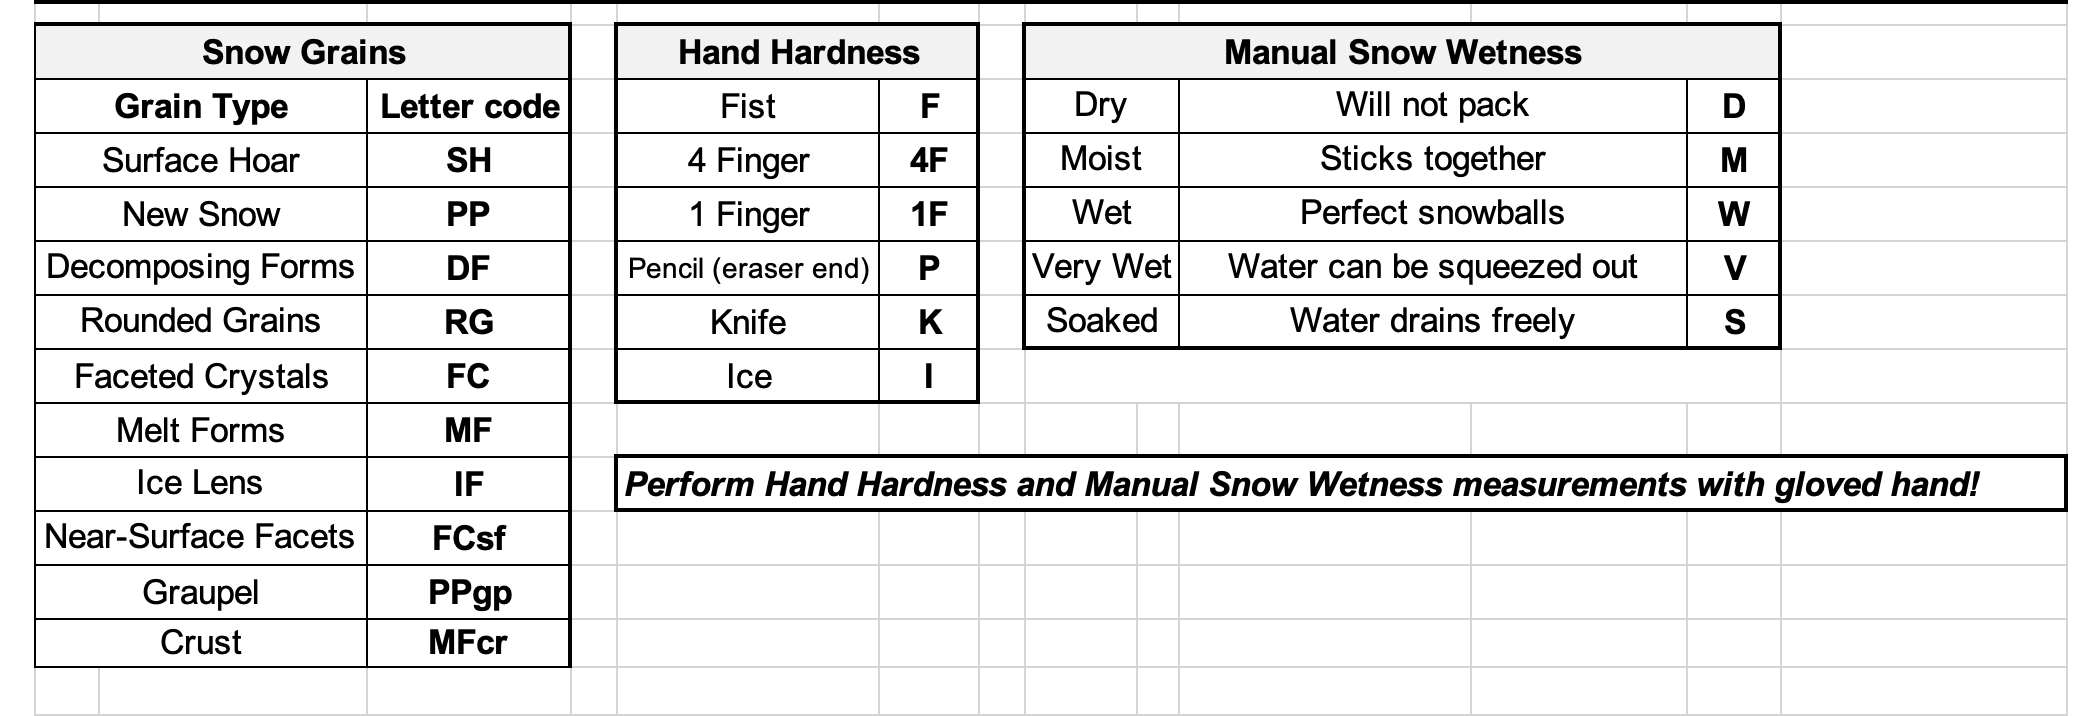
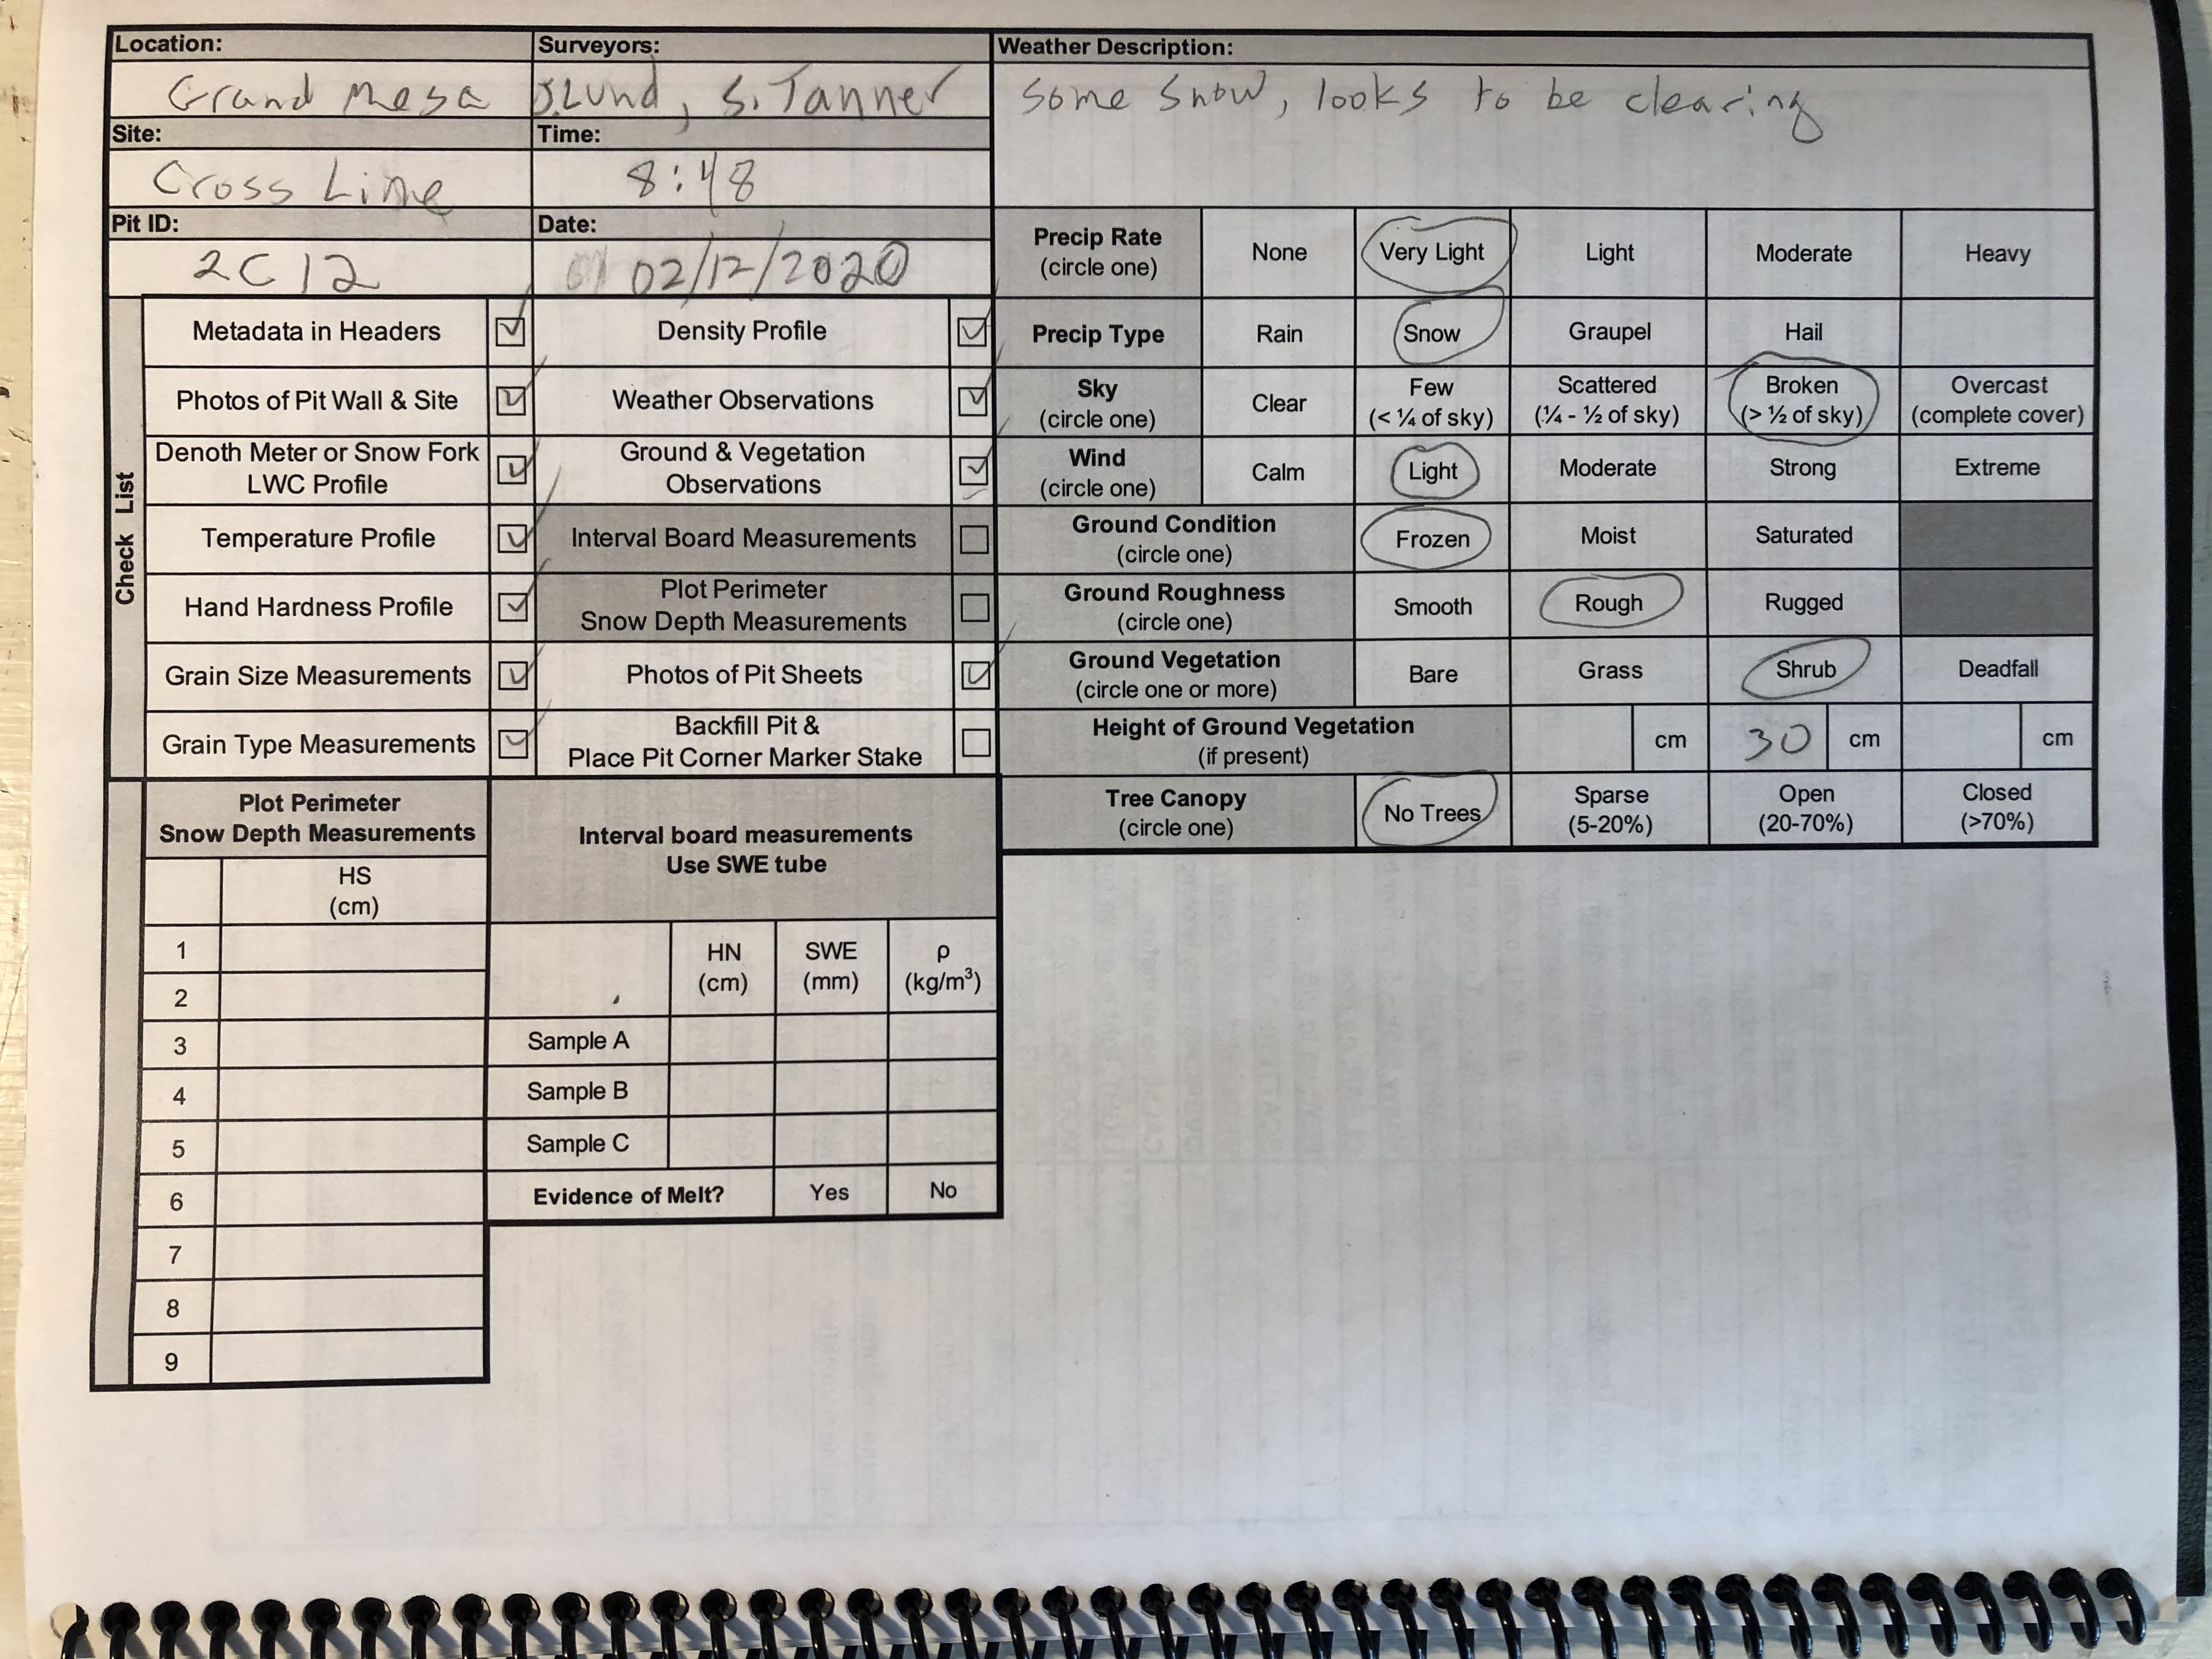
Figure 3. Front and back of the pit sheet field forms. These have largely remained the same throughout the different campaigns. The middle image is a reference for the codes used in the Stratigraphy measurements.
Why do we care about observations from snow pits and other measurements?
90% because we need to validate what we see from airborne and satellite sensors!!
10% because we are geoscientists that want to winter recreate!!
(You can argue those percentages over our movement / coffee break)
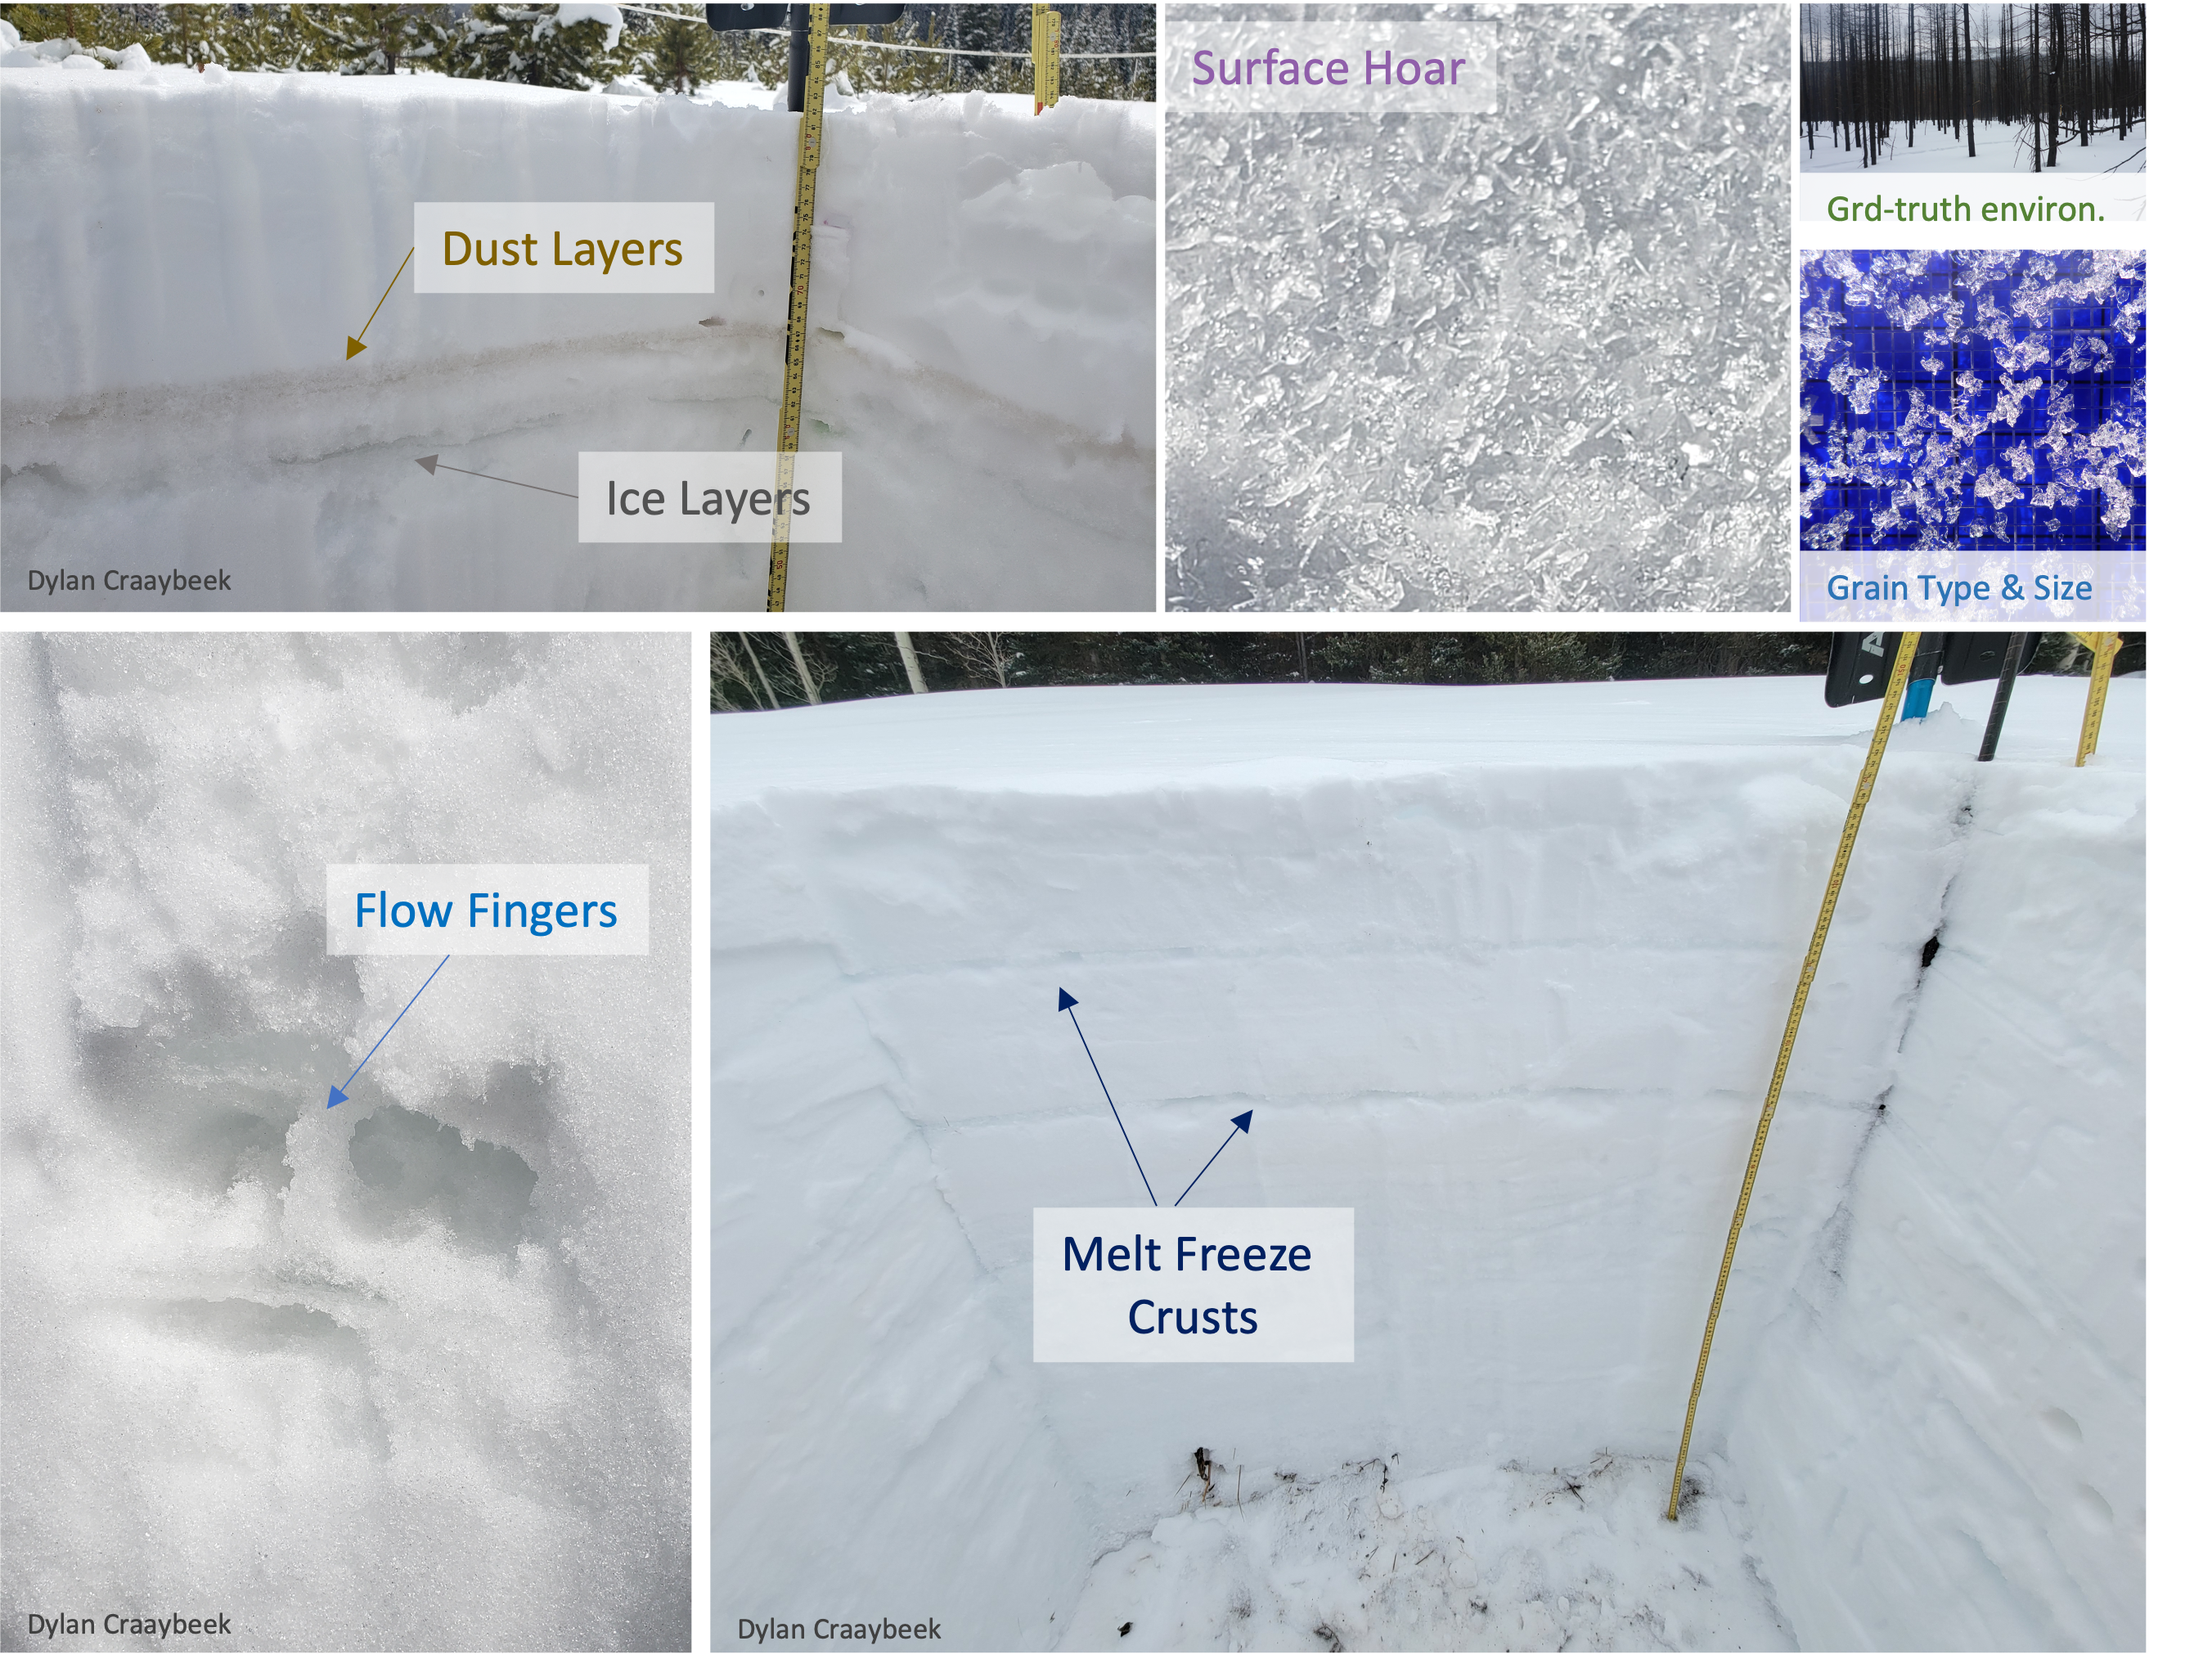
Figure 4. Examples of snow properties and features that are sensitive to modeling and remote sensing signals.
Sampling Strategy and Naming Conventions
2020 Grand Mesa IOP
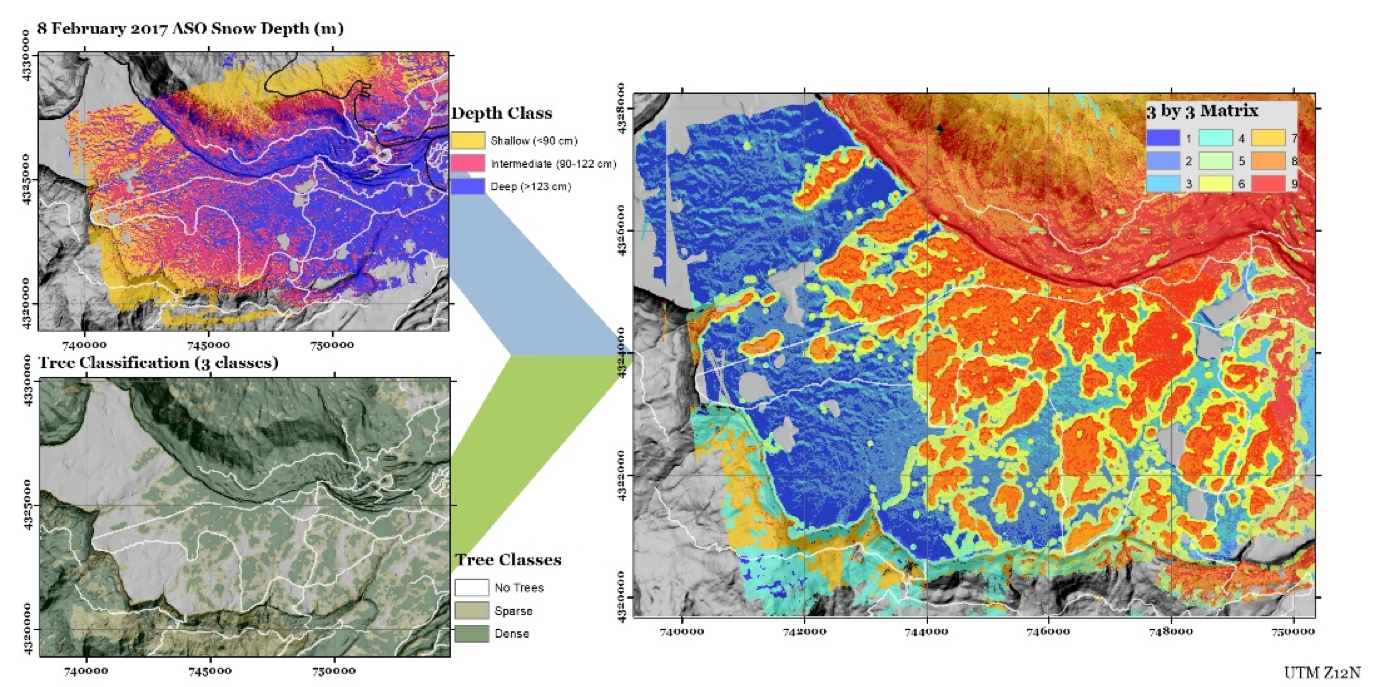
Figure 5 Nine-member snow and vegetation matrix used to sample and name snow pits during the Grand Mesa IOP campaign
Vegetation Classes
1-3 = treeless (0% tree cover)
4-6 = sparse (1-30% tree cover)
7-9 = dense (31-100% tree cover)
Snow Depth Classes
1, 4, 7 = shallow (<90cm)
2, 5, 8 = medium (90-122cm)
3, 6, 9 = deep (>122cm)
Flight Lines
‘C’ = Crossline
‘N’ = North
‘S’ = South
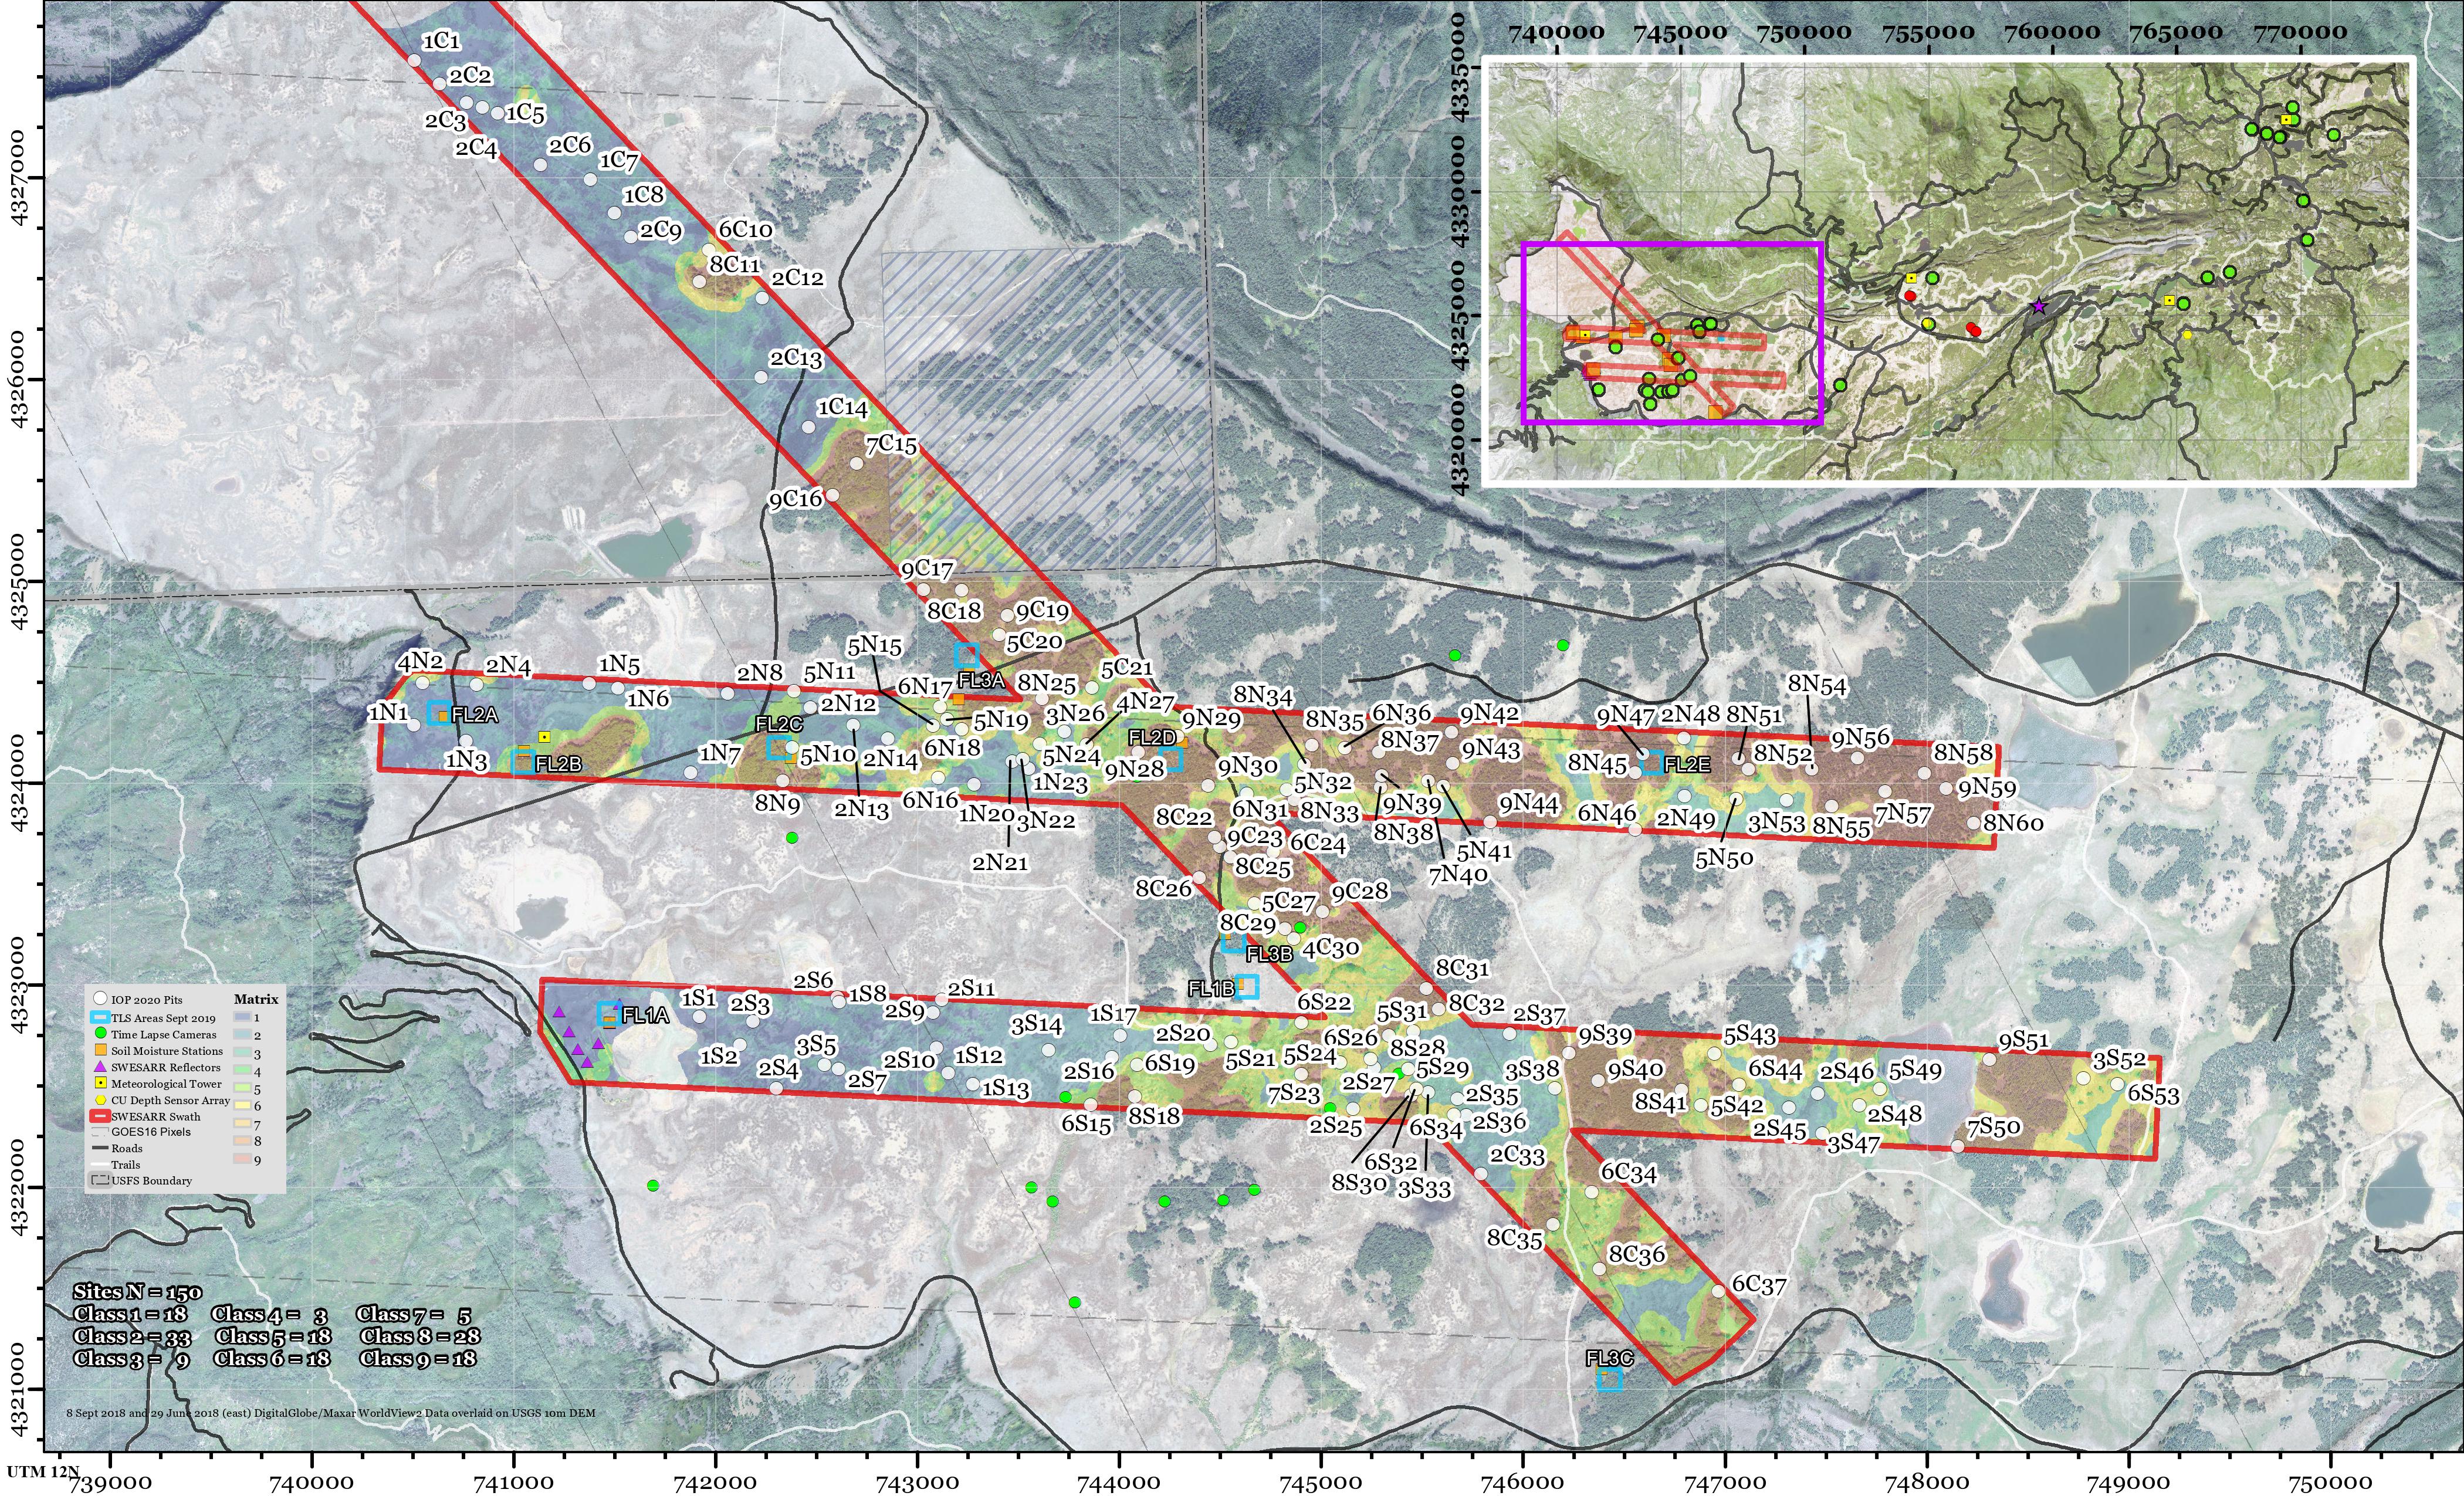
Figure 6. Grand Mesa IOP 2020 sampling design. The rectangles are the lidar, UAVSAR, SWESARR, Thermal IR, and Gamma flight lines. The point markers are the locations of snow pits.
2020 & 2021 Time Series
Location ⇨ Regional Location with existing long-term monitoring infrastructure.
Site ⇨ Averaged unique snow pit site to represent the progression of Time Series snow pits.
PitID ⇨ 6-letter code unique to all snow pit sites; 2-letter state, 2-letter Location; 2-letter site name (e.g Idaho, Boise River, Bogus Upper = IDBRBU
Unique PitID ⇨ 6-letter site code and timestamp (e.g. format: XXXXXX_yyyymmdd_hhmm, example: IDBRBU_20200116_1345)
Table 1. (Preliminary) Comprehensive Site Summary for 2020 and 2021 Time Series Campaign
State |
Location |
Site |
PitID |
Latitude |
Longitude |
Pit Count |
Snow Class |
|---|---|---|---|---|---|---|---|
CA |
American River Basin |
Caples Lake |
CAAMCL |
38.71029 |
-120.04186 |
7 |
3 |
CA |
Mammoth Lakes |
CUES |
CAMLCP |
37.64324 |
-119.02906 |
9 |
5 |
CA |
Mammoth Lakes |
Panorama Dome |
CAMLPD |
37.61964 |
-119.00029 |
6 |
6 |
CA |
Sagehen Creek |
Forest |
CASHFO |
39.42956 |
-120.24211 |
7 |
6 |
CA |
Sagehen Creek |
Open |
CASHOP |
39.43037 |
-120.23982 |
7 |
6 |
CA |
Sagehen Creek |
Tower 4 |
CASHT4 |
39.42216 |
-120.29898 |
6 |
3 |
CO |
Cameron Pass |
Cameron Peak |
COCPCP |
40.56381 |
-105.86761 |
16 |
6 |
CO |
Cameron Pass |
Joe Wright |
COCPJW |
40.52406 |
-105.89345 |
8 |
2 |
CO |
Cameron Pass |
Michigan River |
COCPMR |
40.51864 |
-105.89193 |
22 |
2 |
CO |
East River |
Aspen |
COERAP |
38.92529 |
-106.97109 |
9 |
6 |
CO |
East River |
Forest 12 |
COER12 |
38.92973 |
-106.97824 |
12 |
2 |
CO |
East River |
Forest 13 |
COER13 |
38.92943 |
-106.97777 |
9 |
6 |
CO |
East River |
Forest 14 |
COER14 |
38.92894 |
-106.97757 |
12 |
6 |
CO |
East River |
Gothic |
COERGT |
38.95925 |
-106.99053 |
9 |
6 |
CO |
East River |
Irwin Barn |
COERIB |
38.88812 |
-107.10796 |
13 |
2 |
CO |
East River |
Open 2 |
COERO2 |
38.92661 |
-106.97848 |
9 |
2 |
CO |
East River |
Open 4 |
COERO4 |
38.92627 |
-106.97907 |
12 |
2 |
CO |
East River |
Open 6 |
COERO6 |
38.92669 |
-106.97988 |
9 |
2 |
CO |
East River |
Trench 13 |
COERTR |
38.92920 |
-106.97770 |
5 |
6 |
CO |
East River |
Upper |
COERUP |
38.93331 |
-106.98994 |
12 |
2 |
CO |
Fraser Experimental Forest |
JPL 1 |
COFEJ1 |
39.90556 |
-105.88282 |
35 |
6 |
CO |
Fraser Experimental Forest |
JPL 2 |
COFEJ2 |
39.90612 |
-105.88255 |
26 |
6 |
CO |
Fraser Experimental Forest |
SNB 1 |
COFEB1 |
39.90699 |
-105.87786 |
23 |
6 |
CO |
Fraser Experimental Forest |
SNB 2 |
COFEB2 |
39.90703 |
-105.87904 |
18 |
6 |
CO |
Grand Mesa |
County Line Open |
COGMCO |
39.03053 |
-108.03220 |
12 |
2 |
CO |
Grand Mesa |
County Line Tree |
COGMCT |
39.03223 |
-108.03438 |
10 |
2 |
CO |
Grand Mesa |
Mesa West Open |
COGMWO |
39.03399 |
-108.21390 |
10 |
2 |
CO |
Grand Mesa |
Mesa West Trees |
COGMWT |
39.03282 |
-108.21291 |
7 |
2 |
CO |
Grand Mesa |
Skyway Open |
COGMSO |
39.04511 |
-108.06209 |
21 |
2 |
CO |
Grand Mesa |
Skyway Tree |
COGMST |
39.04565 |
-108.06333 |
18 |
2 |
CO |
Niwot Ridge |
C1 |
CONWC1 |
40.03317 |
-105.54616 |
9 |
6 |
CO |
Niwot Ridge |
Forest Flat |
CONWFF |
40.03186 |
-105.54667 |
12 |
6 |
CO |
Niwot Ridge |
Forest North |
CONWFN |
40.03337 |
-105.55380 |
11 |
2 |
CO |
Niwot Ridge |
Forest South |
CONWFS |
40.04021 |
-105.55701 |
13 |
2 |
CO |
Niwot Ridge |
Open Flat |
CONWOF |
40.03579 |
-105.55205 |
15 |
6 |
CO |
Niwot Ridge |
Saddle |
CONWSA |
40.05497 |
-105.59065 |
7 |
1 |
CO |
Senator Beck |
Senator Beck |
COSBSB |
37.90705 |
-107.72626 |
5 |
1 |
CO |
Senator Beck |
Swamp Angel |
COSBSA |
37.90714 |
-107.71121 |
19 |
2 |
ID |
Boise River Basin |
Banner Open |
IDBRBO |
44.30456 |
-115.23601 |
11 |
6 |
ID |
Boise River Basin |
Banner Snotel |
IDBRBS |
44.30362 |
-115.23457 |
23 |
6 |
ID |
Boise River Basin |
Bogus Lower |
IDBRBL |
43.76434 |
-116.10660 |
17 |
6 |
ID |
Boise River Basin |
Bogus Lower Trees |
IDBRBT |
43.76057 |
-116.08979 |
13 |
6 |
ID |
Boise River Basin |
Bogus Upper |
IDBRBU |
43.75881 |
-116.09019 |
11 |
6 |
ID |
Boise River Basin |
LDP Open |
IDBRLO |
43.73707 |
-116.12179 |
19 |
6 |
ID |
Boise River Basin |
LDP Tree |
IDBRLT |
43.73634 |
-116.12053 |
17 |
6 |
ID |
Boise River Basin |
Mores Creek Summit |
IDBRMC |
43.94735 |
-115.67666 |
3 |
6 |
MT |
Central Ag Research Center |
SnowEx-1 |
MTCASX |
47.05836 |
-109.95688 |
4 |
5 |
MT |
Central Ag Research Center |
Wheat |
MTCAWH |
47.05942 |
-109.95176 |
1 |
5 |
MT |
Central Ag Research Center |
Wx |
MTCAWX |
47.06062 |
-109.95693 |
4 |
5 |
NM |
Jemez River |
BA Flux Tower |
NMJRBA |
35.88859 |
-106.53184 |
8 |
5 |
NM |
Jemez River |
HQ Met Station |
NMJRHQ |
35.85791 |
-106.52137 |
8 |
5 |
UT |
Little Cottonwood Canyon |
Alta Collins |
UTLCAC |
40.57210 |
-111.62997 |
17 |
2 |
UT |
Little Cottonwood Canyon |
Atwater |
UTLCAW |
40.59125 |
-111.63759 |
20 |
5 |
Note - This table is a preliminary comprehensive site summary of the 2020 and 2021 Time Series campaigns. If a site was repeated (e.g. Cameron Pass, Michigan River) then the Pit Count column is a sum of the two years). This is preliminary because we are still adjusting and correcting some of the spatial data after confirming locations and sampling designs with site leads. The Snow Class column was extracted from the 300 m Snow Classification data set (Liston, 2021 and can be accessed here at NSIDC). See the previous notebook to characterize the Snow Classes. This table does not include about ~50 snow pits that were part of the 2021 TS campaign from the Fraser Experimental Forest because of the modified spatial sampling design, but will be included in the published data set, and the table will be updated to reflect those additional snow pits.
This table can be accessed as a geojson from Megan’s github gists
To use this as a geojson in your project:
Navigate to the link above
Check out the map of data (zoom in, zoom out, etc.)
Select the ‘Raw’ button from the top right corner
Copy/Paste the URL (it’s longer now)
Use the code block below to import
import geopandas as gpd
import requests
url = "https://gist.githubusercontent.com/meganmason/dde13c46a90875e364b1c25a31bff1d8/raw/d361e1a56eeb867bd89c87b4dc13ed431ffff6f6/SNEX_TS_SP_avg_prelim_Hackweek.geojson"
gdf = gpd.read_file(url)
gdf.head()
| State | Location | Site | PitID | Latitude | Longitude | Pit Count | Snow Class | geometry | |
|---|---|---|---|---|---|---|---|---|---|
| 0 | CA | American River Basin | Caples Lake | CAAMCL | 38.71029 | -120.04186 | 7 | 3 | POINT (-120.04186 38.71029) |
| 1 | CA | Mammoth Lakes | CUES | CAMLCP | 37.64324 | -119.02906 | 9 | 5 | POINT (-119.02906 37.64324) |
| 2 | CA | Mammoth Lakes | Panorama Dome | CAMLPD | 37.61964 | -119.00029 | 6 | 6 | POINT (-119.00029 37.61964) |
| 3 | CA | Sagehen Creek | Forest | CASHFO | 39.42956 | -120.24211 | 7 | 6 | POINT (-120.24211 39.42956) |
| 4 | CA | Sagehen Creek | Open | CASHOP | 39.43037 | -120.23982 | 7 | 6 | POINT (-120.23982 39.43037) |
Where can I find data?
1. SnowEx data sets are stored and archived at the National Snow and Ice Data Center (NSIDC) in Boulder, Colorado.
Table 2. Summary of Core Data Sets with DOI links for applicable data sets
| Core Data Sets | Parameters Available | Instruments | NSIDC DOI | |
|---|---|---|---|---|
| Snow Pits | Depth, Density, Temp., LWC, Stratigraphy, Grain Size, Wetness, Hand Hardness, Qualitative Environment, SWE |
Standard pit kit | SNEX17_SnowPits_GMIOP
SNEX20_SnowPits_GMIOP SNEX20_TS_SP (in review) SNEX21_TS_SP (future pub.) | |
| Depth Transects | Snow Depth - various sampling designs | MagnaProbe, Mesa2, Pit Ruler | SNEX17_SD
SNEX20_SD SNEX20_TS_SD (future pub.) SNEX21_TS_SD (future pub.) | |
| Interval Boards | New snow, SWE, density | Ruler and spring scale | SNEX20_TS_IB (in prep.)
SNEX21_TS_IB (future pub.) | |